One Waterway. One Decision. A Global Energy Crisis.
On February 28, 2026, Iran closed the Strait of Hormuz — a 33-kilometer waterway carrying 20% of the world's oil and 25% of its natural gas every single day. The consequences were immediate. Oil prices surged 50% within weeks. Japan, routing 90% of its energy imports through the strait, faced factory shutdowns. The Philippines declared a national emergency as fuel prices doubled overnight. Thailand's fishing industry began collapsing under 250% higher marine fuel costs.
China kept running. Not by luck — but because of two decades of deliberate energy strategy built on diversification, electrification, renewable energy, and decentralization.
“The companies and countries that understood energy security before the crisis are the ones still operating at full capacity. The ones that didn't are still recovering.”
This white paper examines the structural causes of the crisis, the data behind global energy dependency, and what the correct strategic response looks like for energy businesses, EPC contractors, and infrastructure investors in the MENA region and beyond.
Five Decades of Energy Disruption — A Pattern the World Ignored
The Hormuz closure was not a surprise. Since 1973, the world has experienced repeated energy shocks — each one reshaping policy, markets, and geopolitical power. The pattern is consistent: disruptions are becoming more frequent and their impacts more severe. Yet the structural dependency on fossil fuels has barely changed.
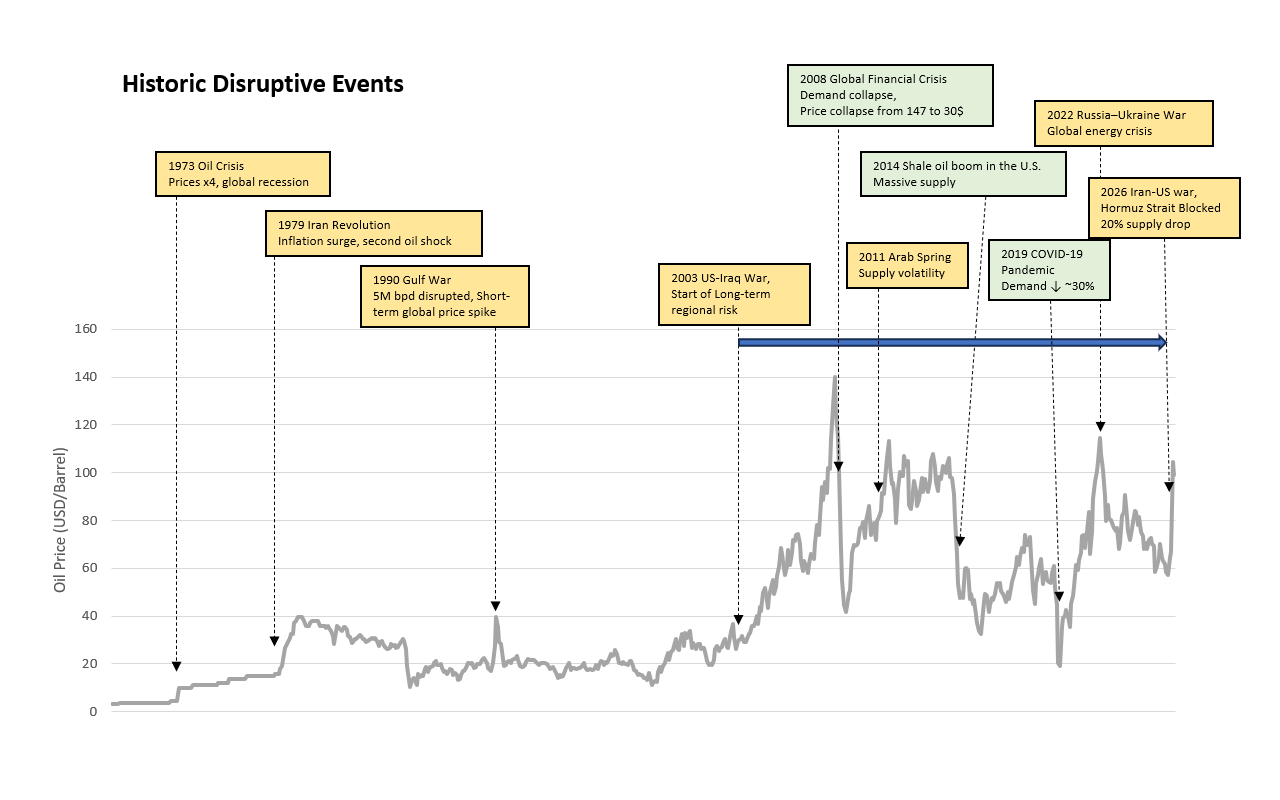
Key Historical Milestones
- 1973 Oil Crisis: OAPEC embargo triggered by the Yom Kippur War. Prices quadrupled overnight. The birth of energy security as a strategic concept.
- 1979 Iran Revolution: Second oil shock. Inflation surged across Western economies. Strategic Petroleum Reserves created.
- 1990 Gulf War: 5 million barrels per day disrupted. Short-term price spike proved the vulnerability of concentrated supply.
- 2008 Financial Crisis: Demand collapse drove prices from $147 to $30 — exposing the inverse fragility of commodity markets.
- 2022 Russia–Ukraine War: Europe's gas dependency exposed. Energy security entered mainstream business and policy discussion for the first time in decades.
- 2026 Iran–US War: Hormuz closure. 20% global supply disruption. The culmination of five decades of unresolved structural dependency.
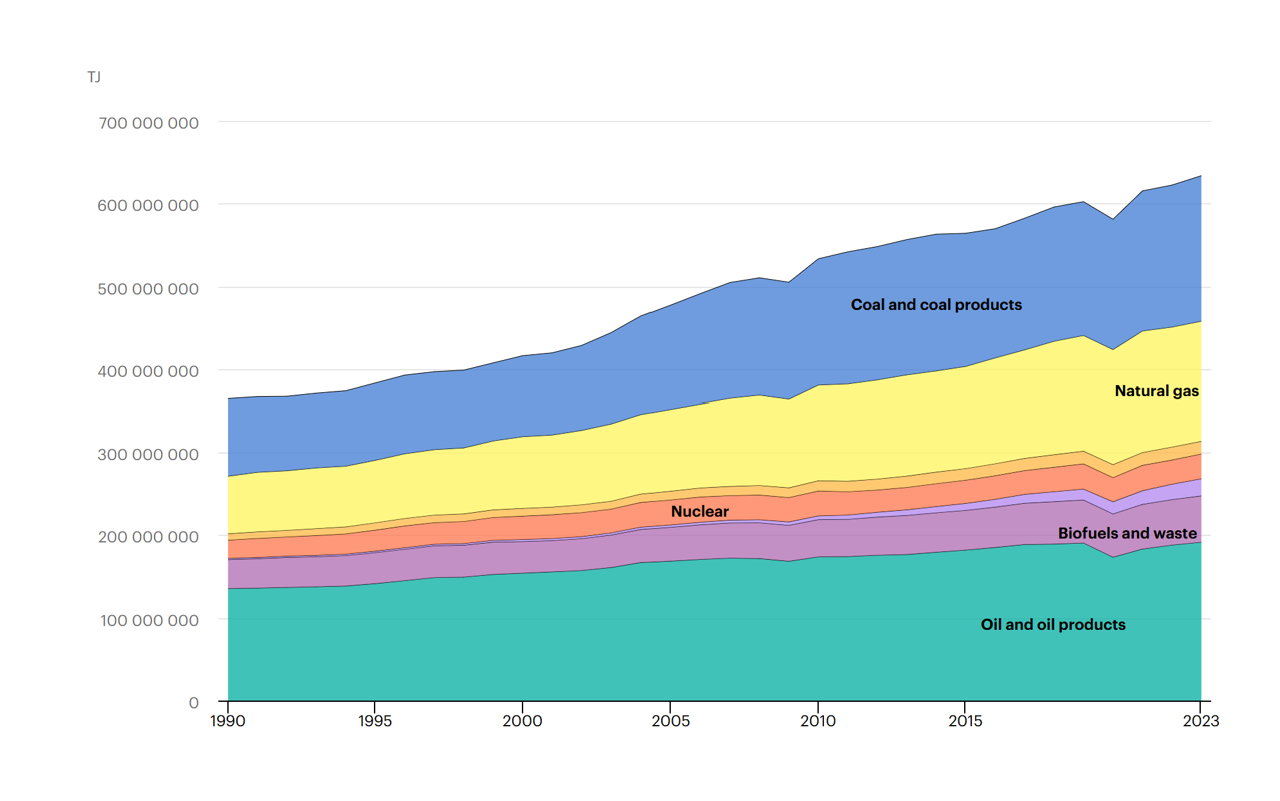
The Data Behind the Crisis: Why 80%+ Fossil Fuel Dependency Is a Strategic Risk
To understand why the Hormuz closure caused such damage, it is necessary to understand the current structure of global energy consumption. Despite decades of investment in alternatives, the world economy remains overwhelmingly dependent on fossil fuels.
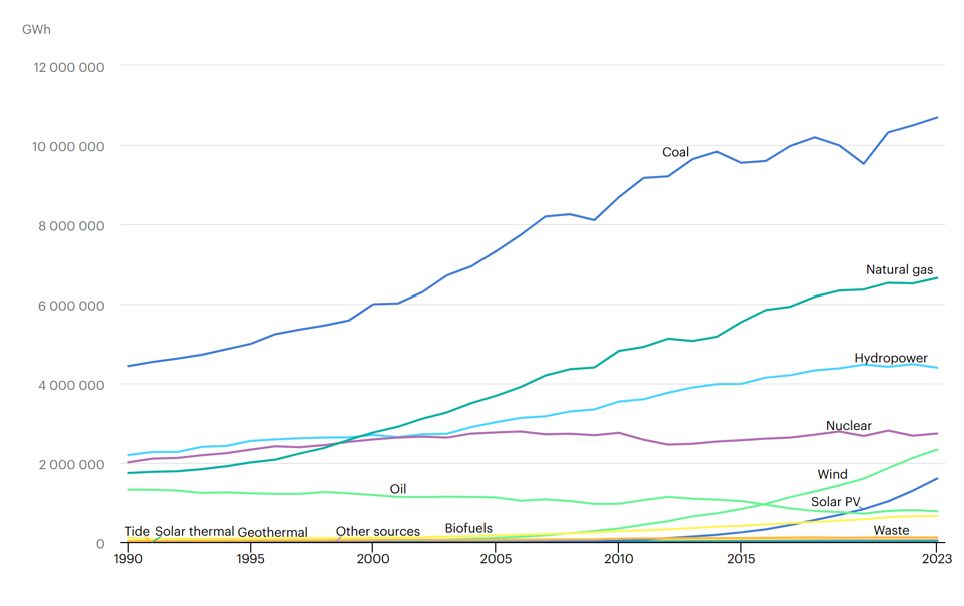
Electricity Is Not as Clean as It Looks
Even electricity — widely regarded as the “clean” energy vector — is still 65% generated from fossil fuels globally. Coal remains the single largest source of electricity generation worldwide. Wind and solar are growing fast but represent a small fraction of total output.
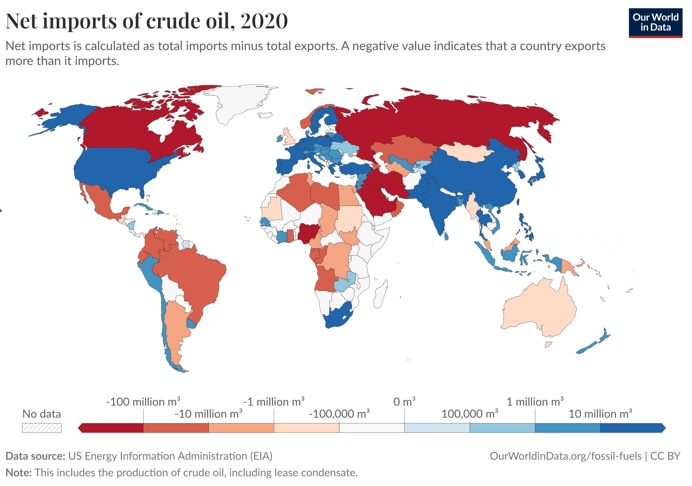
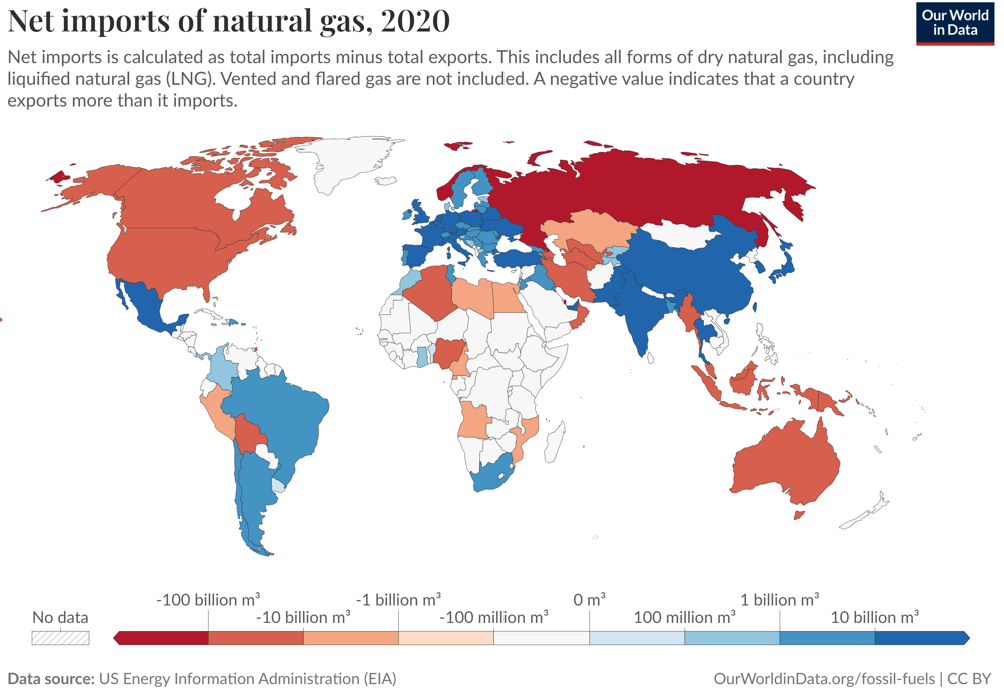
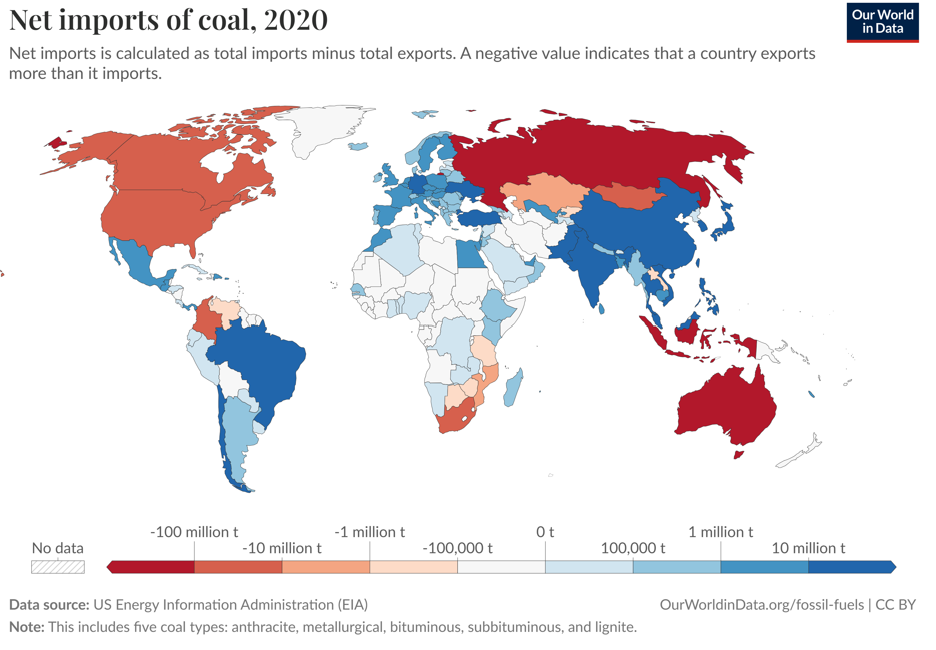
Geographic Concentration Creates Geopolitical Vulnerability
Fossil fuels do not exist everywhere. They are concentrated in a small number of regions, forcing most of the world to import. This dependency transforms energy from an economic input into a geopolitical weapon — as Hormuz demonstrated.
What Energy Security Actually Means — and Why Most Organisations Don't Have It
Energy security is not simply about having enough supply today. It has two distinct dimensions that require fundamentally different strategies.
Reliable access to sufficient energy at affordable prices. Long-term access · supply stability · price predictability.
Ability to maintain operations despite sudden disruptions. Shock response · crisis endurance · rapid recovery capability.
Most countries and companies have focused on the first dimension — securing supply — while largely ignoring the second. The Hormuz crisis demonstrated that resilience requires both, and that a single point of failure anywhere in the supply chain can neutralize decades of procurement strategy.
The Four Pillars of Energy Security for MENA Businesses and EPC Contractors
Countries and companies that emerged from the Hormuz crisis in the strongest position shared a common strategic framework. These four pillars are interdependent — strength in one amplifies the others.
Diversify energy sources — oil, gas, nuclear, renewables — and diversify suppliers and trade routes. No single chokepoint like Hormuz should be able to halt operations. This requires long-term planning, not reactive procurement.
Shift transport, industry, and buildings onto electricity. Electricity can be generated from almost any source — giving businesses flexibility that burning oil directly cannot provide. EV fleets, electric industrial processes, heat pumps.
Solar, wind, and hydro generate power locally. They reduce import dependency, do not pass through geopolitically sensitive waterways, and are insulated from supply-chain pricing pressure. The only energy source with no supply chain.
Rooftop solar, microgrids, and distributed battery storage convert energy from a single point of failure into a resilient distributed network. When the central supply fails, decentralized assets keep operations running.
“Renewable energy alone is not the answer. What is required is an optimized energy mix — different sources complementing each other based on local resources, demand patterns, and geopolitical realities.”
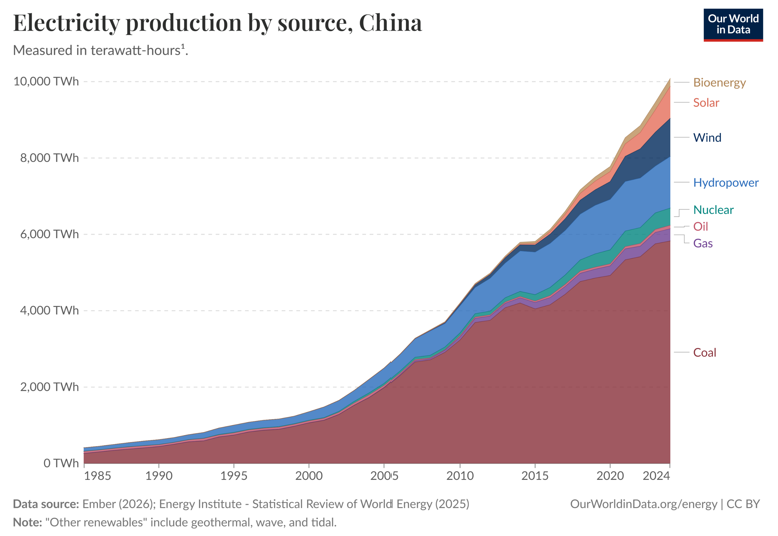
China's 20-Year Energy Transformation: From 90% Coal to 40% Renewable
No country demonstrates the value of long-term energy strategy more clearly than China. In 2005, China was one of the most energy-vulnerable major economies on earth — approximately 90% dependent on coal for electricity, with negligible renewable capacity. Two decades later, the picture is fundamentally different — and the Hormuz crisis proved why that matters.
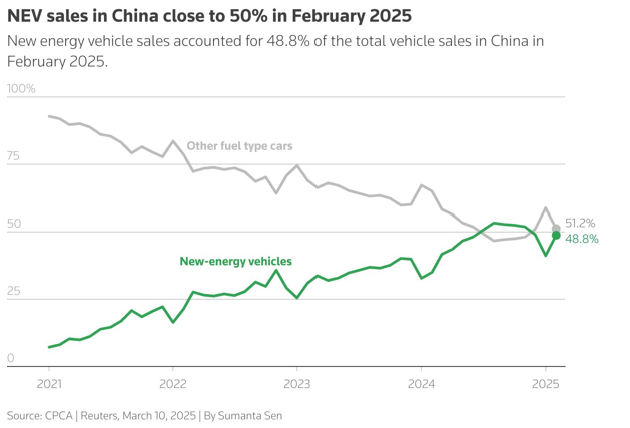
Transport Electrification: The Strategic Masterstroke
China's most strategically significant achievement may be transport electrification. In 2020, new energy vehicles represented just 5% of car sales. By February 2025, nearly 50% of all vehicle sales were electric. The result: when oil prices surged 50% after Hormuz closed, China's transport network largely continued functioning.
- 120,000+ km of electrified railways — over 80% of the network
- 99% electric urban bus fleets in major Chinese cities
- ~30% industrial electrification rate
- 6 major energy sources contributing meaningfully to the grid by 2024
China did not become energy-resilient by accident or by reacting to a crisis. It became resilient by making hard policy decisions early and sustaining them over two decades — before any crisis made urgency obvious.
Energy Security as a Business Imperative: What EPC Contractors and Investors Must Do Now
Energy security is no longer exclusively a government challenge. For industrial companies, EPC contractors, and infrastructure investors in the MENA energy sector, energy is not simply a line item on the balance sheet — it is operational continuity itself.
Questions Every Energy Business Should Be Asking
- What percentage of our energy comes from a single source, supplier, or trade route?
- How many operational days could we sustain if grid power was interrupted for 72 hours?
- What is our real exposure to oil price volatility across our transport, logistics, and manufacturing operations?
- Do we have on-site generation capacity — solar PV, battery storage, backup systems — that operates independently of the grid?
- Is our energy procurement strategy aligned with where regulation and infrastructure investment is heading in our operating region?
The Right Energy Mix for MENA Industrial Operations
There is no single correct energy mix. The right strategy depends on local solar irradiance, grid reliability, regulatory environment, available capital, and geopolitical exposure. However, the directional principles are consistent across the region: diversify sources, electrify where operationally feasible, add local generation capacity, and build battery storage to bridge supply gaps.
For industrial facilities and factories in the UAE, Iraq, Iran, and Mauritania, a practical energy security strategy typically includes: rooftop or ground-mounted solar PV, battery energy storage systems (BESS), connection redundancy across grid sources, and — for mission-critical operations — backup generation that does not depend on imported liquid fuel.
“The Hormuz crisis was not a surprise. Every element that made it devastating was visible for decades. The question is not whether the next disruption will happen. It will. The question is whether your organisation will be running when it does.”
Get a Tailored Energy Security Assessment
HelioVolt provides energy strategy consultancy, solar EPC, and storage solutions across the MENA region — UAE, Iraq, Iran, and Mauritania.
Contact HelioVolt →Resilience Comes From Balance
The Hormuz crisis of 2026 was a stress test that most economies and businesses failed — not because the threat was unforeseeable, but because the structural dependency on a single fuel type, concentrated in politically unstable regions and routed through a single waterway, was never adequately addressed.
The solution is not a single technology. It is a balanced, diversified energy mix designed around local conditions, demand patterns, and realistic risk scenarios. Countries and companies that built this resilience before the crisis kept their lights on and their factories running. The others are still calculating the damage.
Energy security is not a future problem to solve. It is a present decision to make.
- —IEA – World Energy Outlook 2025
- —Energy Institute – Statistical Review of World Energy 2025
- —Our World in Data – Energy & Fossil Fuels (ourworldindata.org)
- —US Energy Information Administration (EIA) – International Energy Statistics
- —CPCA / Reuters – China NEV Sales Data, March 2025. By Sumanta Sen
- —Trading Economics – Crude Oil WTI Historical Price Data
- —Ember – Global Electricity Review 2026